The CMDB visibility problem during incidents
Your CMDB probably holds accurate data — asset relationships, network port connections, impact analysis links. The problem is presentation. During a major incident, service owners and NOC teams need a spatial view of dependencies, not a spreadsheet export or a filtered report that takes five minutes to configure.
When a database server goes down, the immediate questions are: what applications depend on it? Which business services are affected? Are there redundant paths? A query can answer these questions eventually. A topology canvas answers them at a glance.
What ServiceMap does
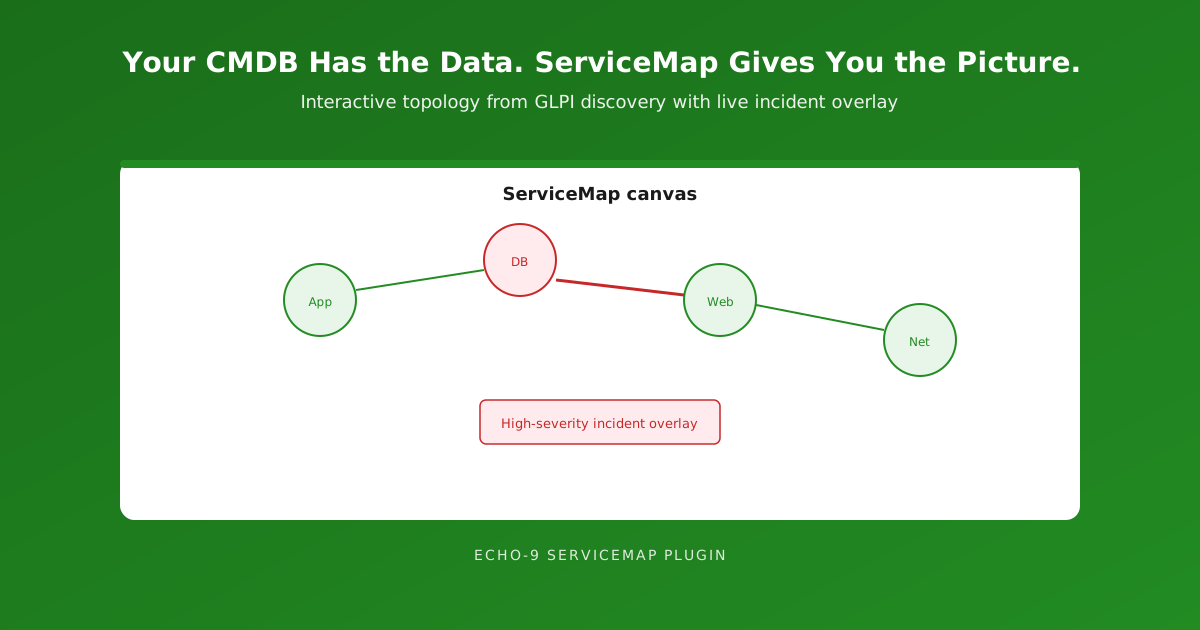
ServiceMap is an Echo-9 plugin for GLPI that turns asset inventory and network port connection data into an interactive topology canvas — a full-screen vector map you can pan, zoom and fit to screen directly from GLPI navigation.
It is deliberately not a bandwidth weathermap. That role stays with Zabbix. ServiceMap is the operational service view: what connects to what, what is in impact analysis, and which configuration items currently have high-severity tickets against them.
Automated mapping from discovery data
ServiceMap builds the picture from GLPI network port connections — no manual drawing of every link. As discovery populates the CMDB, the canvas updates. This connects directly to the asset foundation described in our NCSC OT visibility article: you need accurate inventory before you can visualise it.
Bi-directional sync with Impact Analysis
Changes made visually sync back to GLPI Impact Analysis, and vice versa. The map stays true to the CMDB — it is not a separate diagram that drifts out of date the week after you draw it.
Live ticket overlay
High and very high severity incidents light up the affected CIs on the map. During a major incident, the canvas reflects current service health — not a static snapshot from yesterday's discovery run.
Dependency paths and filters
Colour-coded vectors distinguish critical outages, non-disruptive dependencies and HA clusters. Business service filters let you isolate a stack, search by IP or asset tag, and respect multi-entity security boundaries — important for academy trusts, local government and any organisation running segregated GLPI entities.
ServiceMap in the Echo-9 stack
Each layer does what it does best. ServiceMap answers "what is connected and what is broken?" Zabbix answers "how hard is it working?" Together with GLPI as the system of record, you have operational visibility without maintaining three separate diagrams.
Who benefits most
ServiceMap resonates with organisations that have complex, multi-site infrastructure — universities, academy trusts, local government, NHS trusts and any environment where a flat asset list is insufficient during incident response.
If you are rebuilding CMDB accuracy through discovery, ServiceMap is the visual payoff. Echo-9's Asset Discovery and CMDB Rebuild consulting establishes the data foundation; ServiceMap makes it operational.
The bottom line
During a major incident, you need a picture — not a query.
ServiceMap turns the CMDB from a database you maintain into a canvas you use. Automated mapping, live incident overlay and impact analysis sync mean the view stays current without a separate documentation project.
Request ServiceMap
ServiceMap is available as an add-on to Echo-9 GLPI subscriptions and implementations.