The swivel-chair problem is not a tooling problem — it is an architecture problem
Walk into almost any IT operations centre and you will find the same pattern.
Zabbix fires an alert. Someone opens GLPI — or ServiceNow, or Jira — and manually creates a ticket. Wazuh detects a suspicious process. Someone else copies the event details into a spreadsheet, then raises a separate incident. The service desk closes a ticket without knowing the underlying host is still alerting. Security investigates an event without visibility into the asset's owner, location or change history.
Each tool does its job well. The failure is in the gaps between them.
At Echo-9, we specialise in closing those gaps. Our core proposition is a complete open-source stack — GLPI for IT service and asset management, Zabbix for infrastructure monitoring, and Wazuh for security operations — integrated into a single operational platform rather than three products bolted together after the fact.
This is not integration for integration's sake. It is a deliberate architecture that changes how teams respond, how leadership reports, and how compliance evidence is gathered.
What each layer does — and why separation creates risk
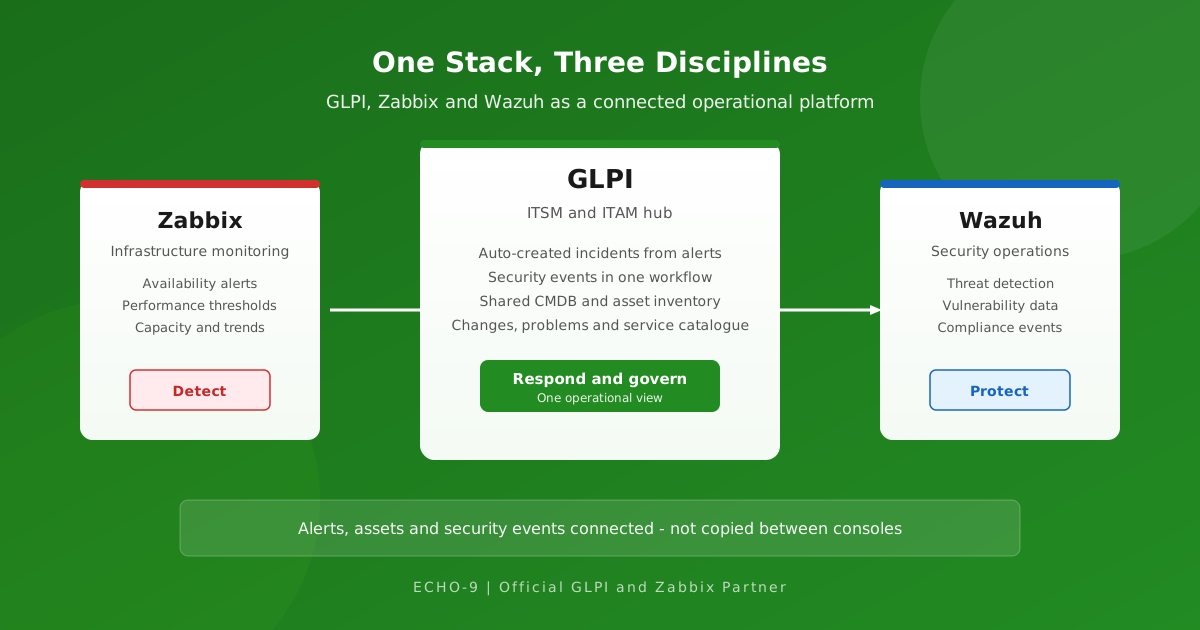
GLPI is the operational system of record. Incidents, problems, changes, assets, users, contracts and the CMDB all live here. When someone asks "what do we own, who supports it, and what is broken right now?" — the answer should be in GLPI.
Zabbix watches the infrastructure. Servers, networks, applications, cloud resources — availability, performance, capacity and threshold breaches. Zabbix knows when something is wrong before users call the helpdesk.
Wazuh watches for threats. File integrity, vulnerability detection, configuration drift, suspicious behaviour and security events across endpoints and cloud workloads. Wazuh knows when something is dangerous, not just slow.
Individually, each platform is mature and capable. Together, without integration, they create three versions of the truth — and three opportunities for context to be lost between detection and resolution.
How the integrated stack works in practice
When Echo-9 deploys the full stack, the integrations are not optional extras. They are part of the operational design.
Zabbix alerts become GLPI tickets — automatically
When Zabbix detects a threshold breach or availability failure, a webhook integration creates a GLPI incident with the alert context already attached: host, trigger, severity, timestamp and diagnostic data. The service desk does not re-type information that monitoring already captured.
This alone cuts mean time to resolution. Analysts start with context, not a blank ticket form.
Wazuh security events feed into GLPI
Security events from Wazuh — failed logins, file changes, vulnerability detections, compliance failures — can be routed into GLPI as incidents or linked to existing tickets. Security and service desk teams work from the same platform, with the same asset and user records.
No more security events trapped in a SIEM console that the helpdesk cannot access.
Wazuh agents sync to GLPI asset inventory
Endpoint data collected by Wazuh agents — operating system, installed software, hardware details — synchronises with GLPI's asset inventory. The CMDB stays current without a separate discovery tool duplicating the same work.
When a security event references a hostname, GLPI already knows what that machine is, who owns it, where it sits, and what software is installed.
Three integration outcomes that matter to leadership
GDPR, ISO 27001, NIST CSF, Cyber Essentials — every framework asks the same underlying questions: what assets do you have, how are they monitored, how do you detect and respond to incidents, and can you prove it?
An integrated stack generates audit evidence as a by-product of normal operations. Asset inventory from GLPI. Monitoring coverage from Zabbix. Security detection and response from Wazuh. Incident records with timestamps and resolution data in GLPI. The evidence trail exists because the work happened in connected systems, not because someone spent a week before the audit pulling reports from three places.
A single pane of glass — without the marketing fluff
"Single pane of glass" is an overused phrase. What we mean is more specific: one operational view where service desk, infrastructure and security teams share the same asset data, the same incident records, and the same reporting.
Zabbix remains the best place to see performance graphs and capacity trends. Wazuh remains the best place to hunt threats and tune detection rules. GLPI remains the best place to manage tickets, changes, assets and service catalogue.
The integration does not replace specialist consoles. It connects them — so the person responding to an incident does not need three logins and a spreadsheet to understand what is happening.
Who benefits most
The integrated stack resonates strongly with organisations that:
- Run multi-site or multi-tenant environments — universities, academy trusts, local government, NHS trusts
- Face compliance pressure — public sector, regulated industries, organisations pursuing Cyber Essentials or ISO 27001
- Are outgrowing disconnected tools — spreadsheets, free-tier monitoring, ad-hoc ticketing
- Want to reduce platform costs — organisations that have seen 40–60% savings replacing proprietary stacks (see our success stories)
We have deployed this stack for a large university that replaced ServiceNow with GLPI, Zabbix and Wazuh and achieved a 60% cost reduction. For an academy trust running 12 schools, a unified platform delivered 50% savings and eliminated the per-school tool sprawl that made central reporting impossible.
Getting started
The stack can be adopted incrementally. Many organisations begin with GLPI as their service desk and CMDB, add Zabbix for monitoring, then layer Wazuh for security operations. Each addition connects to what is already in place.
Echo-9 offers subscriptions, implementations, and ongoing UK-based support across all three platforms — cloud-hosted, on-premise, or hybrid. As an official GLPI and Zabbix partner, we bring certified expertise, not just installation.
The bottom line
Service management, monitoring and security are not three separate problems. They are three views of the same infrastructure — and they should share the same data.
If your teams are still copying alert details between consoles, your CMDB does not reflect what your security tools see, and your compliance evidence requires a manual scramble before every audit — the architecture is working against you.
The integrated stack fixes that. Not with another dashboard, but with connected platforms that do what they do best and share what they know.
Discuss your integrated stack
Whether you are starting with one platform or planning a full GLPI, Zabbix and Wazuh deployment, we would welcome a conversation about your environment and goals.